
Figure 5.37. Example of a 20-day simple moving average (red) as compared to a 20-day exponential moving average (white)
Technical Analysis – Mathematical Trading Methods (Indicators)_003
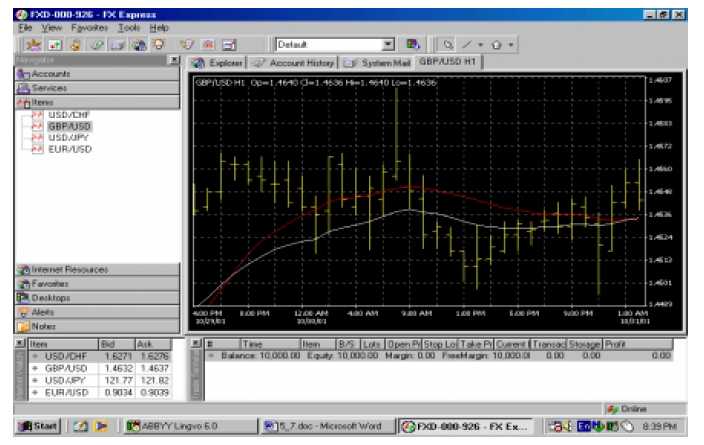
Figure 5.37. Example of a 20-day simple moving average (red) as compared to a 20-day exponential moving average (white)