
FIGURE 4.8 The market comes back to the 1.6291 zone one month later on the
GBP/USD four-hour chart. Notice the repeated touches from above and below.
© 2000–2011, MetaQuotes Software Corp.
forexsignal_032
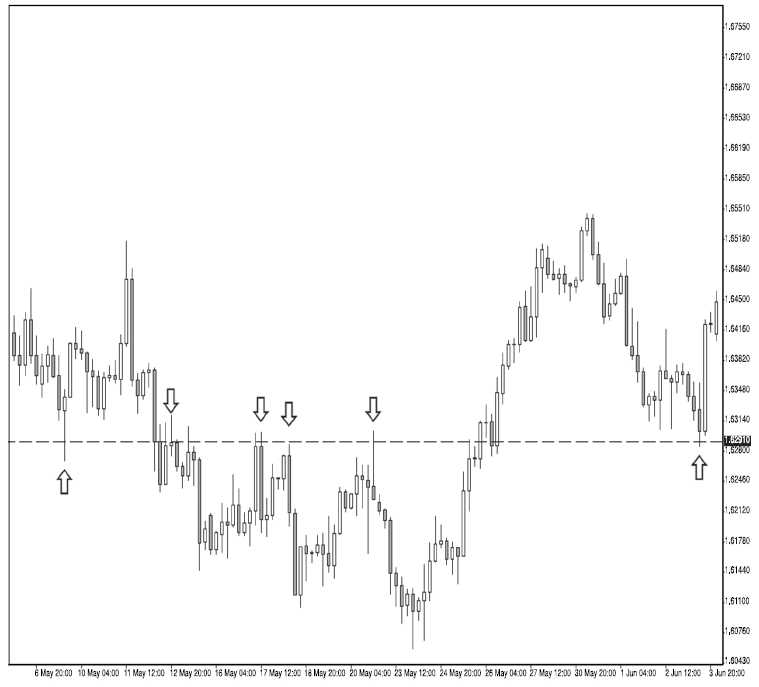
FIGURE 4.8 The market comes back to the 1.6291 zone one month later on the
GBP/USD four-hour chart. Notice the repeated touches from above and below.
© 2000–2011, MetaQuotes Software Corp.