
FIGURE 4.7 The 1.6291 level on the GBP/USD one-hour chart appears to be an
extreme low, so a zone is assumed at this level.
© 2000–2011, MetaQuotes Software Corp.
forexsignal_031
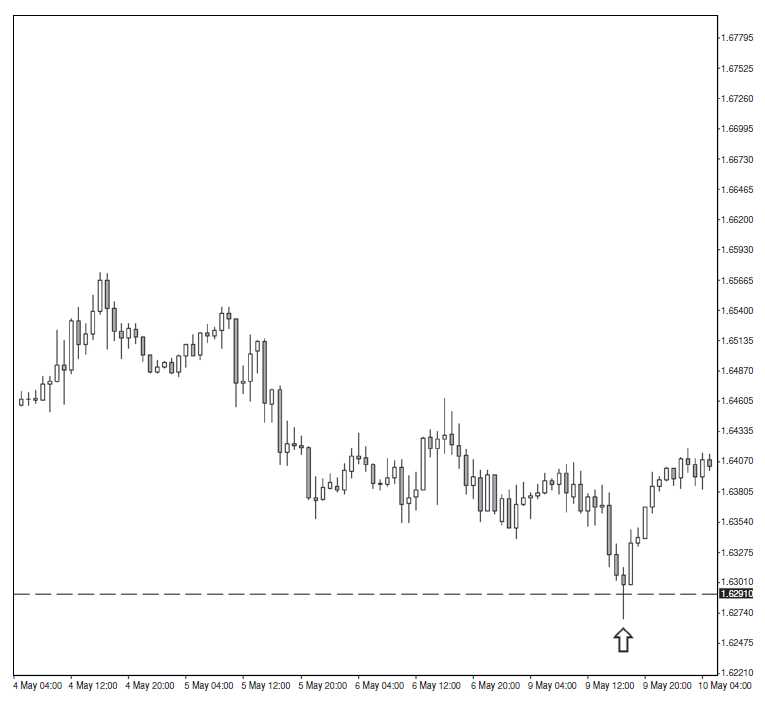
FIGURE 4.7 The 1.6291 level on the GBP/USD one-hour chart appears to be an
extreme low, so a zone is assumed at this level.
© 2000–2011, MetaQuotes Software Corp.